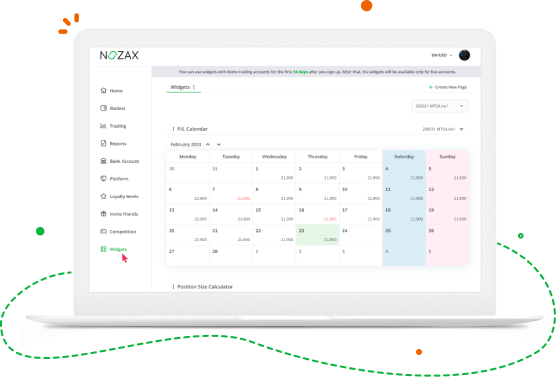
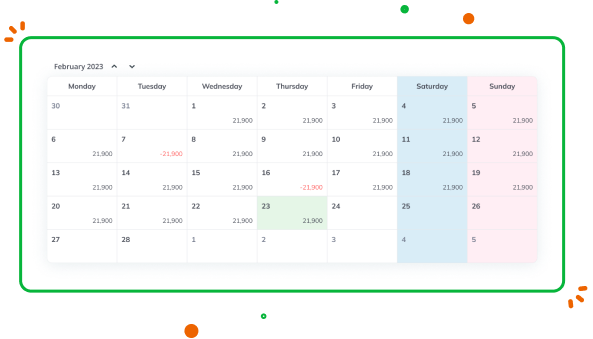
A Profit and Loss (P/L) calendar enables you to keep track of your trading activity and performance on a monthly basis. It records the gains or losses made on each trade during the month and calculates the total profit or loss for that month.
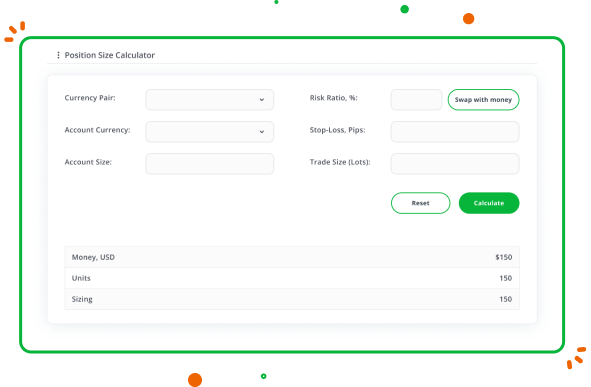
Position Size Calculator
A Position Size Calculator helps you determine the appropriate amount of currency to buy or sell based on your account balance, risk tolerance, and the size of your stop loss.
Margin Calculator
A Margin Calculator helps you calculate the number of funds required to open and maintain a position in the forex market. By using a Margin Calculator, you can determine the amount of margin required for a given trade and ensure that you have enough funds in your account to cover it.
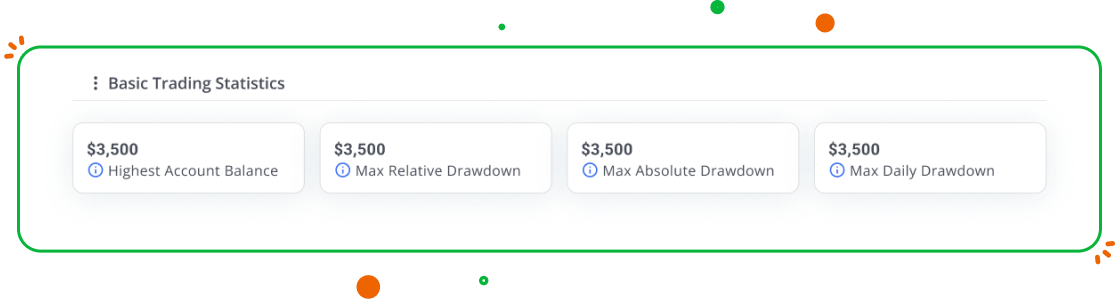
Basic Trading Statistics
Highest Account Balance
refers to the highest value that a trader’s account balance has reached over a certain period of time.
Max Relative Drawdown
is the difference between the highest local balance value and the next lowest account balance value.
Max Absolute Drawdown
is the difference between the initial deposit and the minimal level below initial deposit throughout the whole history of the account.
Max Daily Drawdown
is the difference between balance at the beginning of day and the lowest balance value throughout the day.
Trade Volume Statistics
The trade volume statistic, including the Median and MAD (Mean Absolute Deviation), can help traders gain insight into their trading habits and identify potential areas for improvement. By understanding their trade sizes and hold times, traders can work towards creating a more consistent and profitable trading strategy.
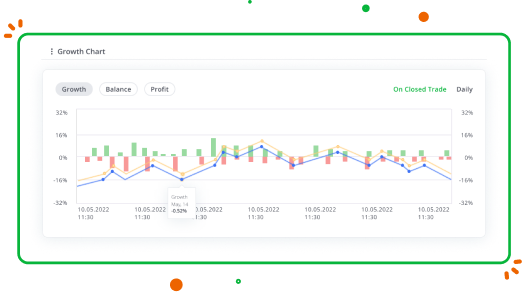
Growth Chart
The Growth Chart is a graphical representation of a trader’s account balance over a certain period of time. It plots the change in the account balance over time, typically using a line graph, to show the growth or decline of the account.
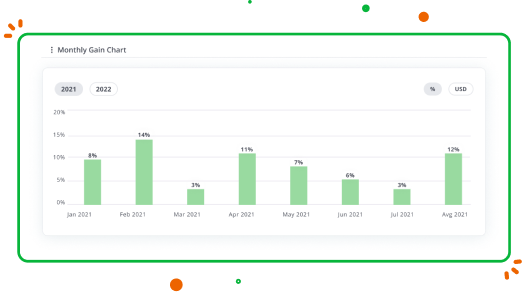
Monthly Gain Chart
The Monthly Gain Chart is a graphical representation of a trader’s monthly gains (or losses) over a certain period of time. It plots the percentage change in the account balance at the end of each month, typically using a bar graph, to show the monthly performance of the account.
Let’s begin by exploring the CP Widgets
P/L Calendar
A Profit and Loss (P/L) calendar enables you to keep track of your trading activity and performance on a monthly basis. It records the gains or losses made on each trade during the month and calculates the total profit or loss for that month.
Position Size Calculator
A Position Size Calculator helps you determine the appropriate amount of currency to buy or sell based on your account balance, risk tolerance, and the size of your stop loss.
Margin Calculator
A Margin Calculator helps you calculate the number of funds required to open and maintain a position in the forex market.
By using a Margin Calculator, you can determine the amount of margin required for a given trade and ensure that you have enough funds in your account to cover it.
Basic Trading Statistics
Highest Account Balance
refers to the highest value that a trader’s account balance has reached over a certain period of time.
Max Relative Drawdown
is the difference between the highest local balance value and the next lowest account balance value.
Max Absolute Drawdown
is the difference between the initial deposit and the minimal level below initial deposit throughout the whole history of the account.
Max Daily Drawdown
is the difference between balance at the beginning of day and the lowest balance value throughout the day.
Trade Volume Statiscs
The trade volume statistic, including the Median and MAD (Mean Absolute Deviation), can help traders gain insight into their trading habits and identify potential areas for improvement.
By understanding their trade sizes and hold times, traders can work towards creating a more consistent and profitable trading strategy.
Growth Chart
The Growth Chart is a graphical representation of a trader’s account balance over a certain period of time. It plots the change in the account balance over time, typically using a line graph, to show the growth or decline of the account.
Monthly Gain Chart
The Monthly Gain Chart is a graphical representation of a trader’s monthly gains (or losses) over a certain period of time.
It plots the percentage change in the account balance at the end of each month, typically using a bar graph, to show the monthly performance of the account.
Risk Disclosure
Trade Responsibly.CFDs are complex instruments and come with a high risk of losing money rapidly due to leverage.
You should consider whether you understand how CFDs work and whether you can afford to take the high risk of losing your money.
Montenegro Office
Email:
info@modivmarkets.com
FX Business Development Manager
Location: Philippines, Malaysia, Thailand, Indonesia.
Requirements
A university degree in Finance/ Economics/ Banking/ Business Administration or related field
Relevant experience in Sales or as a Forex Business Developer
Existing Introducing Broker, Money Manager, or Affiliate network in one or more of the following countries: Philippines, Malaysia, Thailand, Indonesia
Thorough understanding of the Forex industry
Exceptional networking skills
Understanding of how fundamental and technical analysis works
Ability to communicate in English fluently
Responsibilities
Create and implement business development strategies
Identify and initiate new business opportunities
Develop relationships with prospective partners and foster existing key partnerships
Maximize revenues within your network
Follow the compliance department’s recommendations for processing client documentation in accordance with requirements
Benefits
Competitive salary with great bonus plans
A chance to develop your career within a fast-moving European Fintech Company
Passionate multicultural team and awesome team bonding gatherings
Accountant
Location: Podgorica, Montenegro
Contract type: Full time
We are looking for an Accountant to manage our financial statements.
Your responsibilities would include auditing financial documents and procedures, reconciling bank statements, and calculating tax payments and returns. To be successful in this role, you should have previous experience with bookkeeping and a flair for spotting numerical mistakes.
Ultimately, you will provide us with accurate quantitative information on the financial position, liquidity, and cash flows of our business, while ensuring we’re compliant with all tax regulations.
Requirements
BSc in Accounting, Finance, or a relevant degree
Minimum 3 years of work experience as an Accountant
Strong attention to detail and good analytical skills
Responsibilities
Manage all accounting transactions
Publish financial statements on time
Handle monthly, quarterly, and annual closings
Ensure timely bank payments
Compute taxes and prepare tax returns
Manage balance sheets and profit/loss statements
Audit financial transactions and documents
Reinforce financial data confidentiality and conduct database backups when necessary